|
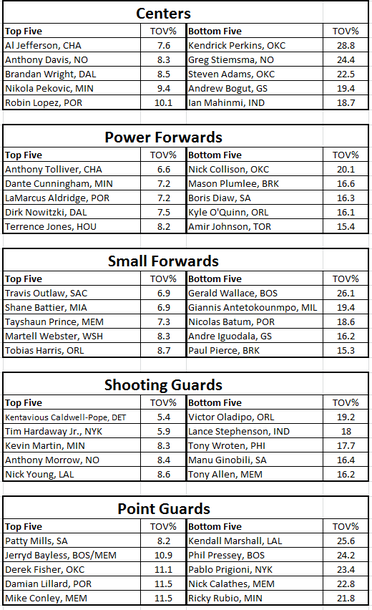
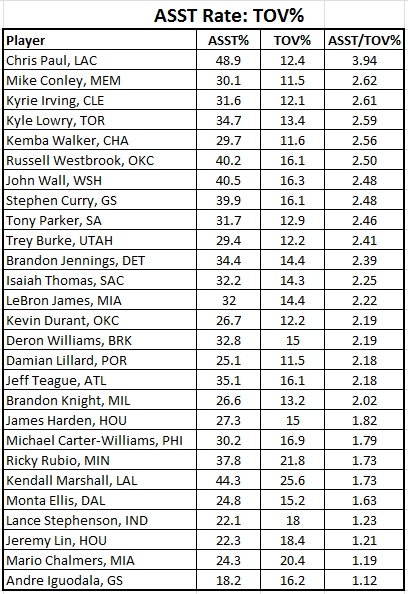
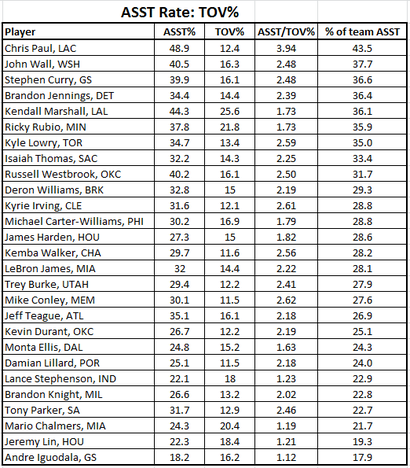
The little things matter in basketball, and the NBA is no exception to that rule despite common conception. It's still a league where attention to detail and doing the "little things" create the razor thin margin for error most teams operate within. In a league where most teams have talent that can score the ball, the teams that win the most games and have the best offenses maximize their possessions, and the efficiency of offenses these days is a large focus of that maximization. That can mean a lot of things: getting shots from the right players or places on the floor, winning offensive rebounding battle, having great sets in special situations (end of clock, baseline and sideline out of bounds), or winning the turnover battle. Turnovers need to be quantified massively in determining efficiency and effective output. Whether based off great pressure from defense or poor execution by the offense, the turnover battle can be indicative of the result of one single game, if not indicative of a larger trend. Additionally, we've seen that to maximize possessions and get higher-percentage shots, teams that move the ball well and have higher assist numbers generally have a greater offensive output. We can see within each system what teams do a great job at this: low team turnover rates or assist numbers are indicative of success. What about on the individual level? Is there a way to quantify a player's "safeness" with the ball for the role that they serve in? Can we examine it across offensive systems without being dependent on teammates or coaching? Probably not, but knowing what to look for when analyzing a player's performance is key. I'll walk you through the process I used to see how strong a player really is with the ball. These numbers are from the 2013-2014 season, as I attempt to remove recency bias, which can be strong when looking at players within their current framework.  TOV% Turnover percentage is a stat that quantifies the turnovers that a player has per 100 possessions. The stat is really only a real indicator for players with a large enough sample size (players on pace for around 1000 minutes played in an entire season). But it goes a long way to showing how responsible they are with the ball and how trusted they can be, particularly in crunch time. Here's a breakdown of stats from last season with the top five at each position with at least 1000 minutes played. The table shows that the players that are more catch-and-shoot players at the shooting guard, small forward and power forward positions are not very turnover prone. The players who handle the ball more at those positions, like Boris Diaw, Andre Iguodala and Lance Stephenson, have higher turnover rates - a byproduct of their playing style, not a surprise. But there are a couple of aberrations, particularly for players who play such meaningful minutes. To see Dirk and LaMarcus Aldridge in the top five is incredibly encouraging; Tobias Harris and Nick Young both handle the ball quite a bit on the perimeter and don't have high turnover rates. The most meaningful data collected here was at the center and point guard positions. At center, we see that Kendrick Perkins turns it over four times more frequently than Al Jefferson despite getting such fewer opportunities to touch the ball. Among point guards, Patty Mills is astoundingly ahead of the pack at 8.2 Point guards have overall higher numbers than all other positions due to the frequency at which they handle the ball. Lillard and Conley, two starters, are on this list despite high usage. Kemba Walker as just outside the top five at 11.6. On the flip side, Ricky Rubio is nearly twice that total with a 21.8 turnover rate. For a player who doesn't shoot a lot, the turnovers likely are to be higher, but this seems really high for a player that just received a four-year extension. It's very telling that the Thunder had three frontcourt players with over a 20% turnover rate: Perkins, Adams and Collison -- hard to argue with Durant and Westbrook's usage rates when their teammates turn it over so frequently. It could also be that the lack of spacing created by so many non-shooters heavily contributes to the turnover rates of unskilled interior players. On the other end of the spectrum was Portland, with three starters in the top five at their position in turnover rate in Lillard, Lopez and Aldridge. It made up for Nicolas Batum's fairly high 18.6 turnover rate (again a product of his usage). The only other team with two starters in the top five at their position was Minnesota with Pekovic and Martin. Turnover statistics, beyond just sheer turnovers and A:TO ratio, are important for frontcourt players as well as guards. But turnovers, by and large, are indicative of playing with the ball in one's hands. An old coaching paradigm is that a turnover is always the passer's fault, and turnover statistics only half-heartedly reflect that. In seeking to balance the TO% numbers with ball-handling metrics, I combined it with ASST% stats, which calculate the percentage of teammates' field goals that the player assisted on. By dividing the turnover percentage per 100 possessions into the percentage of assists, I got this stat: assist to turnover usage ratio. It focuses mainly on those who handle the ball frequently and have high assist numbers. The question seeking to be answered here: do these players create more buckets for their teammates than they cost them by turning the ball over?  This metric seeks to quantify the impact of a ball handler in a "net-positive" sense. The relation between assist and turnover numbers are directly related to the amount of time a player has the ball in his hands. The only way to level the comparisons between players with different usages is to divide the usages together. Chris Paul has long been regarded as the top creator for others in this league, and a stat like this reinforces that. He's a full point and a third ahead of the next-best qualifier, Mike Conley. Only six players are at 2.5 or above, and only Westbrook and Irving had a usage rate above 25% (meaning they took a high volume of their teams shots). John Wall and Stephen Curry, two very different types of players, have a similar impact. The three players here that caught my eye were LeBron James, Kevin Durant and James Harden. Look where the past two MVP's are: 2.22 and 2.19, ahead of Damian Lillard, who was in the bottom of the league's turnover rate. But James Harden is below 2.0, meaning that for every two baskets he assists on, he'll cost his team more than one possession. When I see that, combined with his defensive woes, I note the vast improvements he's made since becoming a primary ball handler in Houston and the effects D'Antoni's system had upon him this past season.  The other factor that needs to be accounted for is the team's system of sharing the ball. Some teams and offensive systems rely on a guard to distribute the ball to others. So I added on a new column to the ASSTrate/TOV% graph with that player's percent of their team's assists per 48 minutes. This table tries to lay the responsibility within each team's system to create assists for others. Some players' numbers will be high if they're the only one expected to create for others. For example, the four lowest on the list are Parker, Chalmers, Lin and Iguodala. Chalmers, Lin and Iguodala have a teammate on this list with a higher percentage, meaning they aren't the main creator on their teams. Parker's numbers are indicative of the extra passing system the Spurs run - assists aren't expected to come just from Parker, they come from the offense. Studying the team's assist trends across their roster in comparison to other teams around the league reinforces that idea. The players highest on this list have the ball in their hands the most on their team: Chris Paul, John Wall and Stephen Curry dominated possessions frequently with the ball in their hands. It speaks both to the coaching system and the lack of other playmakers on their teams at the time, which leads to how that system is built. Some teams may have an incredibly high amount of their assist burden concentrated on two players. For example, Durant and Westbrook combined for 56.8% of their team's assists per 48 minutes last season, meaning that while their turnover rates may be high, the system is designed around them having the ball, so those turnovers are at least coming within the confines of where the usage should be. Curry and Iguodala combined for 54.5%, the next highest teammate tandem on the list. The highest tandem in the league: Phoenix's Eric Bledsoe and Goran Dragic at 59.5%. But the biggest value that the % of team assists statistic shows in this table comes in comparing it with the ASSTrate/TOV% value. When the A:TO rate is high and the % of team assists is low, it means that a player is exceptional at creating for others and maximizing each possession. Tony Parker is the prime candidate here: he assists on 31.7% of buckets while he's on the floor despite not being a prime creator in percentage of the offense, but he takes care of the ball while doing so. Damian Lillard and Mike Conley also fall into this category, mainly because they take care of the ball. Their assist totals aren't as indicative of success because the offense gets assists from elsewhere. Parker doesn't have the flashy stats, nor does Conley, but both excel in accomplishing what they are asked to do. Harmony between ability and role is crucial to success. Conversely, a player with a low A:TO rate and a high % of teams assists gets gaudy numbers in terms of assists because their system relies on them, not because they make tons of great plays. The numbers are driven by two things: high turnover rates (like Ricky Rubio and Kendall Marshall) or domination of the ball within their offense (like Michael Carter-Williams' rookie campaign and James Harden). A player with high outputs in each column is heavily leaned upon in their offense and does pretty well within it. Obviously Chris Paul is the leader here; Kyrie Irving (this is from the days LeBron was in Miami) and Kyle Lowry get high marks here as well. A player with low outputs in both columns means they likely aren't the primary option within their offense as a creator and their turnovers are to the detriment of their team more than their assists are a positive. This includes players like Jeremy Lin and Mario Chalmers. So what the hell does this all mean? It means that we need to look at more than an assist to turnover ratio to see the true value of a point guard. Figure out how much they're being asked to do, both in terms of scoring and creating for others. Then see, based on that usage, how they protect the ball. Hopefully stats like these can serve as indicators as for who does the most good for their team.
0 Comments
Leave a Reply. |
Adam SpinellaHead Boys Basketball Coach, Boys' Latin School (MD). Archives
September 2021
Categories |
 RSS Feed
